

The Cost of Nigeria’s Spiraling Inflation Rate on the Average Household
Thematic Macroeconomy Update

In this report, we attempted to examine the impact of Nigeria’s pressured macroeconomic fundamentals over the past 2 years, especially the high inflation rate, on the purchasing power of the average household and its effect on their allocation of disposable income towards consumption expenditure. To drive this objective, we leveraged the most recent Gross Domestic Product (GDP) by Income and Expenditure approach data, monthly inflation rate data, and the National Living Standard Survey (NLSS) data from the NBS.
For context, data on the GDP by income approach provides information on the amount earned by owners of factors of production (that is, disposable income) over a period of time, usually a quarter or a year. On the other hand, data on the GDP by expenditure approach shows the allocation of income earned by households, governments, and institutions between consumption and savings over a specific period. Meanwhile, the NLSS is a compendium of data that focuses on measuring living conditions, including how the average household’s final consumption expenditure is allocated among the several components of food and non-food baskets.
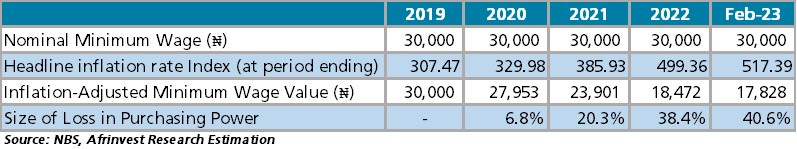
We observed that since the national minimum wage was raised to ₦30,000 from ₦18,000 in 2019, the headline inflation rate index has risen by about 68.3ppts from 2019 year-end to 517.39 points in February 2023. As a result, when adjusting the value of the minimum wage rate for inflation over this period, our estimate suggests that the purchasing power of the average household with sticky wage rate has been eroded by 40.6%, leaving the them worse-off in real terms compared to pre-2019.
Chart 1: Cost of Nigeria’s Spiraling Inflation Rate on Household Purchasing Power
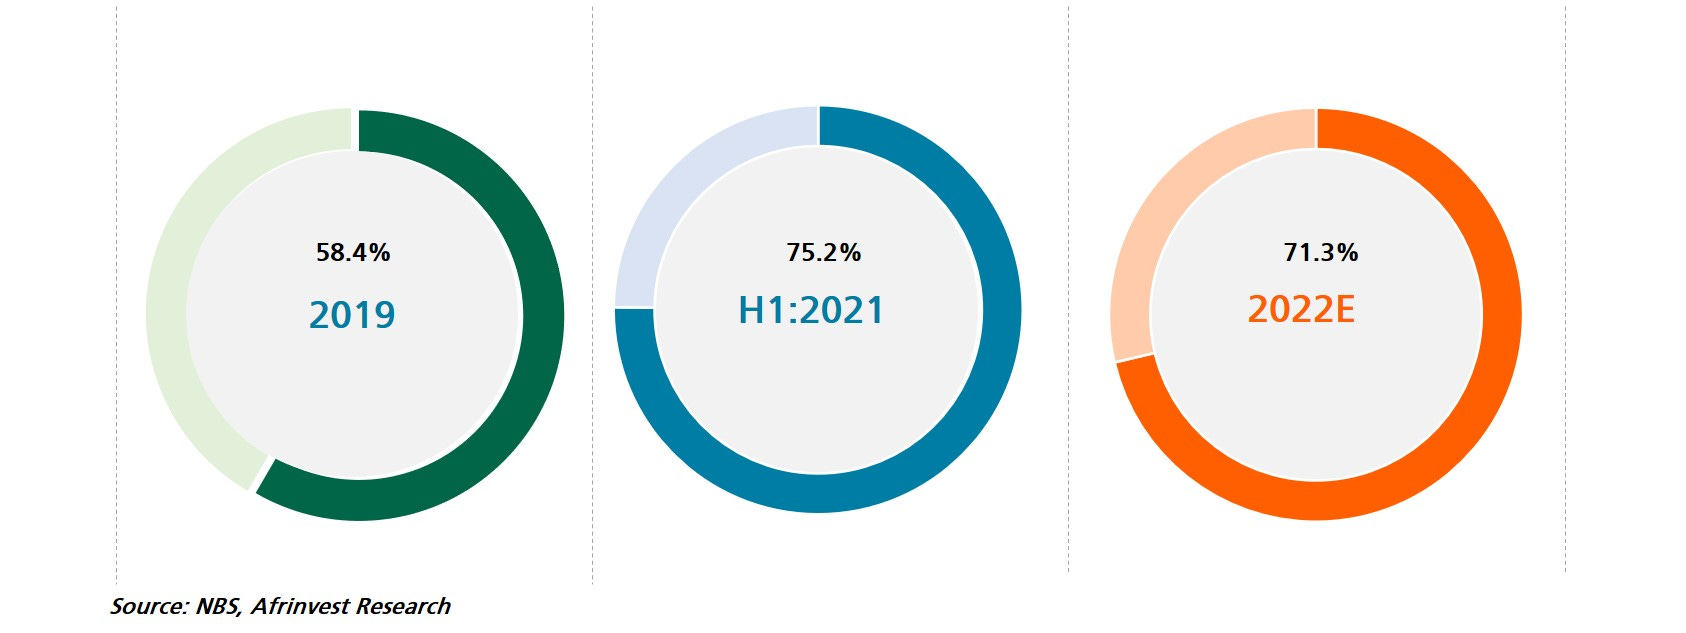
Connecting this to the average household allocation from disposable income, we estimate that the share of final consumption expenditure of the average households in the inflation-adjusted national disposable income is about 71.3% in 2022, implying a 3.9ppts reduction from the level last reported by the NBS in H1:2021 but way above the 2019 level. Furthermore, the increase connotes weaker level of savings – with potential negative consequences for current and future economic health of households.
To elucidate further, when the NBS last published the GDP by income and expenditure data in Q2:2021 for the period Q1:2018 to Q2:2021, we observed that the share of final consumption expenditure of households in the inflation-adjusted national disposable income had risen from 58.4% in 2019 to 75.2%, while national savings fell from 35.5% to 17.9%.
Chart 2: Share of Average Households’ Real Disposable Income Allocated to Final Consumption Expenditure
This is not surprising given that Nigeria’s inflation rate began to spiral in August 2019 (from an average of 11.4% to 18.8% in 2021) after land borders were shut to food importation amid the structural plague on domestic capacity. The average inflation rate reading has even worsened to 18.8% in 2022, no thanks to the additional pressure from the global supply chain stoked by the war in Eastern Europe.
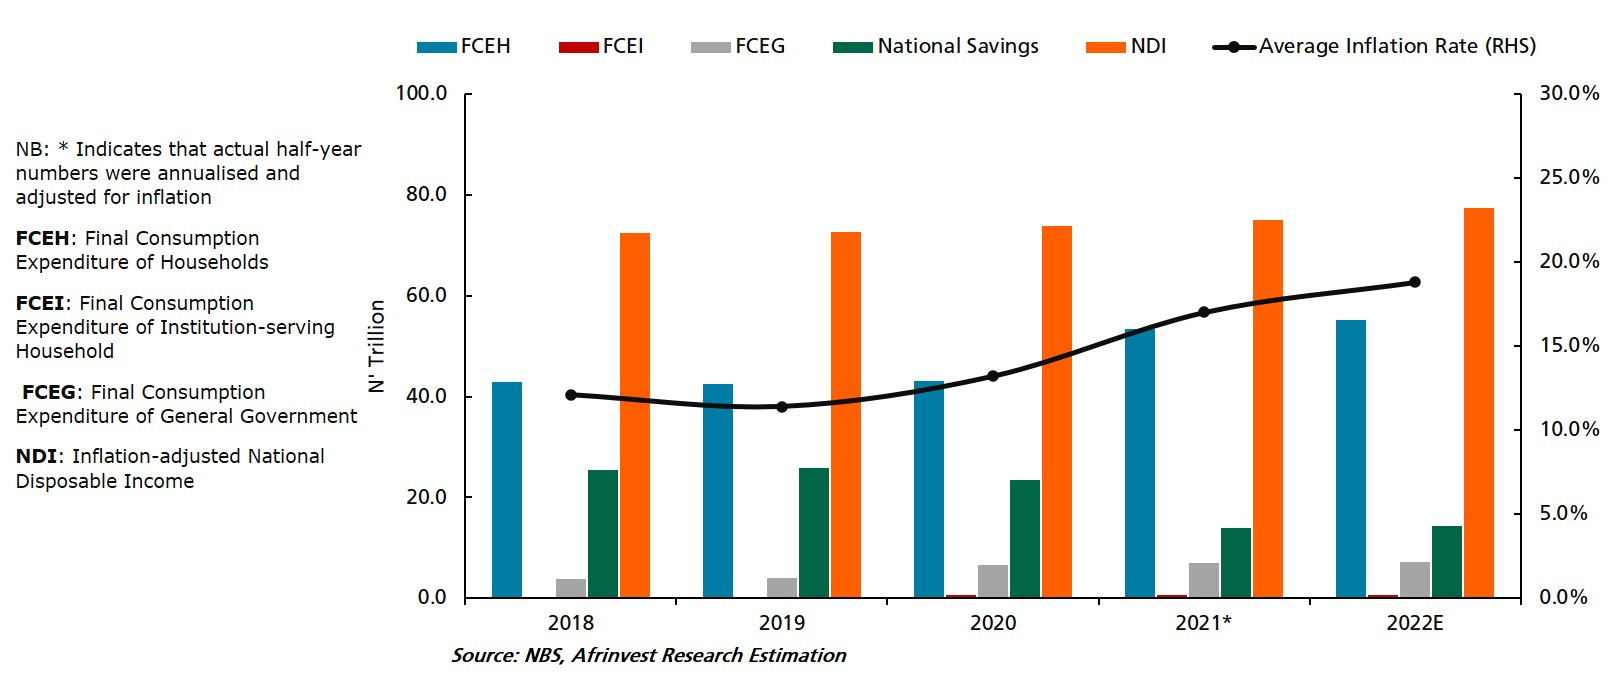
Based on our model output, the share of final consumption expenditure of households in the inflation-adjusted national disposable income reduced mildly to 71.3% in 2022 from 75.2% in Q2:2021, due largely to the estimated sharp increase of 250.1% in the share of final consumption expenditure of the general government to ₦7.3tn over the period. Despite the estimated modest decline in the share of final consumption expenditure of households in disposable income in 2022, it is evident that compared to 2019, the average household have raised the share of disposable income allocation to final consumption expenditure by more than 10.0ppts in each of the last 2 years just to sustain consumption/living standard.
Chart 3: Cost of Nigeria’s Spiraling Inflation Rate on Disposable Income Distribution
More so, the 2019 NLSS revealed that an average household deploys about 56.7% share of disposable income allocation to final consumption expenditure on food items. Given that the increase in the food inflation rate index since 2019 year-end (about 80.7ppts) outpace growth of core inflation rate (about 54.6ppt), we estimate that for the average household living on the ₦30,000 minimum wage to still be able to purchase half (i.e., 50.0%) of the volume/quantity purchased in 2019, the share of final consumption expenditure on food items would have to increase to a range of 58.3% to 61.5%, other factors remaining constant. As such, we conclude that:
I. Nigeria’s spiraling inflation rate would continue to hurt the growth in the domestic savings rate, and by extension investment capacity of the average household and the economy at large, due to declining purchasing power.
II. Final consumption expenditure on critical non-food items such as education and health by the average household may further decline in the years ahead if the inflation scourge persists. Hence, this may result in a decline in productivity per capita in the medium to long-term.
III. Given that prices are usually sticky downward, a modest upward review in the minimum wage rate combined with a concerted effort targeted at boosting output level in the near term (to curb demand-pull inflation) and taming supply-side shocks would be key to preventing more households from falling below the poverty line.